The EU agreed to be net-zero by 2050.
Are the 27 member states on track?
Further explanations
How are negative emissions possible?
Emissions can be shown including or excluding the LULUCF category. The LULUCF category includes
carbon emissions and removals from land use, like forests, agriculture, etc. In countries with
large forest cover, this category will produce negative emissions, which means storing more
greenhouse gases than emitting.
In addition to natural sinks, there are also technologies that aim to remove carbon from the atmosphere,
often referred to as CCUS (carbon capture, utilisation and storage). Currently, all CCUS projects
within Europe amount to less than 3Mt of CO₂eq removal per year (IEA CCUS database).
There are some doubts regarding the high level of negative emissions in some scenarios,
e.g. while Sweden officially states approx. -40 Mt CO₂eq in the LULUCF sector for 2020,
Climate Watch
has a more moderate estimate of approx. -11 Mt CO₂eq.
What does net-zero actually mean?
Reaching net-zero, which the EU plans to do by 2050, implies not emitting more emissions than are being removed within the EU27 states. This is why the LULUCF category is highly relevant for measuring progress towards net-zero.
What’s the difference between WEM and WAM scenarios?
Every EU member state must report projected emissions to the EU based on current national and European legislation. This scenario is called “With Existing Measures" (WEM). The most up-to-date scenario considers the climate impact of laws enacted by January 1st, 2022. Countries also report their policies and measures (PaMs) alongside the projected emissions.
Calculating emissions under the "With Additional Measures" scenario is optional. It relies on a somewhat vague assumption, considering laws likely to be enforced soon. Currently, 21 of the 27 EU countries have projected their future emissions using this scenario. The WEM scenario offers a more cautious estimate of emissions trends by not accounting for laws enacted after January 1st, 2022. In contrast, the WAM scenario provides a more optimistic projection, assuming that additional laws with higher ambition will come into effect.
Where can I find the data?
Data of the future projections is taken from the EEA Data hub, which provides a summarised version of the 27 raw data files, but currently contains less detailed data than the raw data. We used this in the EU-27 overview chart, as it includes a WEM Scenario for every member state until 2050. The raw data of the countries doesn't.
Raw data: For our detailed visualisations of each sector and country, we used the raw data that can be downloaded from the European Environment Agency's (EEA) e-Reporting platform for environmental and climate data reporting (folder: "1a1b5a5b").
The EEA provides an overview website for the emissions data.
Historical emissions data was downloaded from the UNFCCC.
When will the charts be updated?
The historical data will be updated every year. Each of the EU-27 countries must report its emissions with more than 100 subsectors to the UNFCCC by January of the following year. For example, the national emissions data for 2023 will be updated in January 2025.
Data on projected emissions was last updated in 2023, with the next scenarios expected in 2025. The WEM dataset expected in 2025 will take into consideration legislation as of 1.1.2024.
Which laws are relevant for the projections of WEM and WAM?
The EEA provides a Policy Database Link: To display all policies and measures which are part of the WEM scenario set the filter “Status of implementation” to “Adopted” & “Implemented”. Similarly, for the WAM scenario set it to “planned”. To get a summary, see the policy overview website of the EEA.
Which factors are not included in these scenarios?
Any legislation that came into force after January 1st, 2022, is not included in the WEM (with existing measures) scenarios. Also, due to the nature of how these projections are calculated and reported, they do not take into account more recent events that have impacted emission levels. These include the war in Ukraine, rising energy prices or economic downturns in industrial economies, all of which have impacted emission levels across the 27 member states.
What about the 2030 and 2040 EU targets?
Ahead of its 2050 target of reaching net-zero, the EU is also aiming to reduce emissions by -55% by 2030 compared to 1990. This target is distributed among member states along an effort sharing methodology, which necessitate emission reductions ranging from -10% to -50% compared to 2005 for every EU member state.
The EU is currently developing an additional 2040 target. The European Scientific Advisory Board on Climate Change recommends a reduction target of -90% to -95% compared to 1990. The EU commission is expected to communicate its guidance on the 2040 target soon.
How is this relevant to the +1.5°C-target of the Paris Agreement and the Global Stocktake?
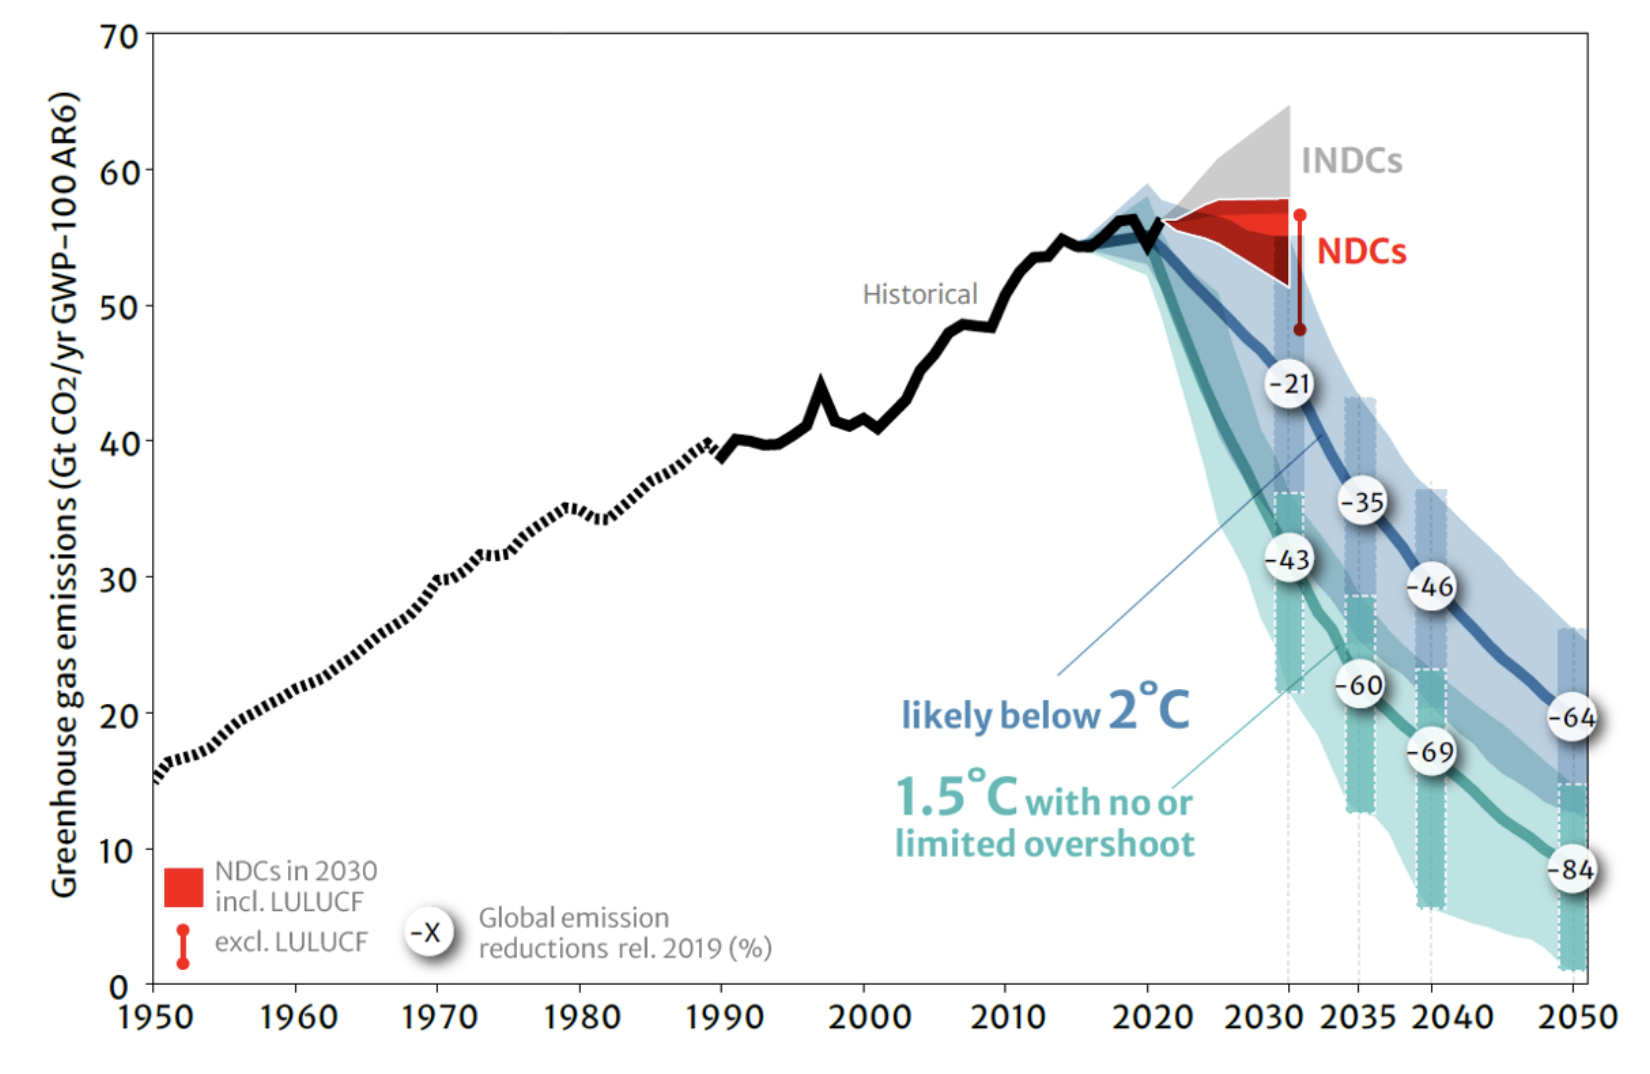
Under the Paris Agreement, the contributions of all parties are checked against the +1.5°C-target defined in Paris in 2015 under a 5-year review cycle known as the "Global Stocktake". The first stocktake concluded at COP28, acknowledging that countries’ current targets are not in line with reduction pathways that would make it possible to limit global heating to 1.5°C or "well below 2°C".
This website presents a more regional stocktake, ranking all EU member states against the EU’s own climate targets. It is important to note however that the EU’s climate targets are not considered in line with the +1.5°C-target under a fair share consideration.
Further Reading
How are the sectors defined?
Countries report their emissions to the UNFCCC according to a fixed format, the so-called CRF (Common Reporting Format). We allocate the sub-sectors to the sectors as follows:
- Energy
- 1.A.1.a Public Electricity and Heat Production
- 1.A.1.b Petroleum Refining
- 1.A.1.c Manufacture of Solid Fuels and Other Energy Industries
- 1.A.3.e Other Transportation (Please note: This sector includes emissions from pipeline operations (1.A.3.e.i) and ground activities at airports (Mobility: 1.A.3.e.ii) because the sector is not broken down into i & ii in the countries' projections.
- 1.B.1 Solid Fuels
- 1.B.2 Oil and Natural Gas
- 1.C CO₂ transport and storage
- Agriculture
- 1.A.4.c Agriculture/Forestry/Fishing
- 3.A Enteric Fermentation
- 3.B Manure Management
- 3.C Rice cultivation
- 3.D Agricultural Soils
- 3.E Prescribed burning of savannahs
- 3.F Field Burning of Agricultural Residues
- 3.G Liming
- 3.H Urea application
- 3.I Other carbon-containing fertilisers
- 3.J Other
- Industry
- 1.A.2 Manufacturing Industries and Construction
- 2.A Mineral Industry
- 2.B Chemical Industry
- 2.C Metal Industry
- 2.D Non-Energy Products from Fuels and Solvent Use Electronics Industry
- 2.E Product Uses as Substitutes for ODS
- 2.F Other Product Manufacture and Use
- 2.G Other
- Buildings
- 1.A.4.a Commercial/Institutional
- 1.A.4.b Residential
- 1.A.5 Other
- Mobility
- 1.A.3.a Domestic Aviation
- 1.A.3.b Road Transportation
- 1.A.3.c Railways
- 1.A.3.d Domestic Navigation
- Waste
- 5.A Solid Waste Disposal
- 5.B Biological Treatment of Solid Waste
- 5.C Incineration and Open Burning of Waste
- 5.D Waste Water Treatment and Discharge
- 5.E Other
- Memo
- Memo.1.D.1.a International Aviation
- Memo.1.D.1.b International Navigation